- Domains
- DNS Management
- Content Delivery Network
-
Cloud Containers
- Overview
-
Using Containers
- Creating and Managing
- Connecting to a Container
- Swapping the Image
- Domain Aliases
- Environment Variables
- Protected Environment Variables
- Backing Up
- Automatic Updates
- SSL Support
- Adjusting Execution Time Limits
- Upgrading Apache Image
- Renaming a Container
- Port Management
- Caching
- Cloning/Overwriting
- Restoring a Backup
- Production Mode
- Metrics Dashboard
- Accessing supervisord
- Container Deprecation
- SSH / SFTP Users
- Databases
- Volumes
- Custom Images
-
Technical Guides
- Create a NodeJS Container
- Creating a Service Container
- Working with .NET Core Web Containers
- Working with Node.js Web Containers
- Working with Umbraco Web Containers
- Deploying your application with git
- Python Container
- Enable Country-Level blocking in Cloud Containers
- Working with SQL Server Containers
- Working with the SilverStripe Caching folder
- Profiling a site using Xdebug on Cloud Containers
- Working with SilverStripe Containers
- NGINX Proxy for Service Containers
- Tuning PHP OPcache
- Deploying phpList on SiteHost Cloud Containers
- Deploying Mautic on SiteHost Cloud Containers
- Deploying n8n on SiteHost Cloud Containers
- Working with ModSecurity on Apache+PHP containers
- Low Disk Warnings & Upgrades
- Local Development
- Virtual Servers
- Dedicated Servers
- Private Cloud
- Cloud / Shared Hosting
- Email Hosting
- Monitoring & Bandwidth
- Account & Billing
- Developers
- SSL Certificates
- Networking
- AI Platform
Metrics Dashboard
Overview
Like Cloud Container Servers, all managed servers have access to a Metrics Dashboard. This dashboard allows you to monitor overall server health. This can be useful when diagnosing issues related to your applications and services.
The metrics available for a managed server are similar to those available for Cloud Container Servers, but do not include any container-specific metrics.
Metrics dashboards are only available for managed servers.
Usage
Signing In
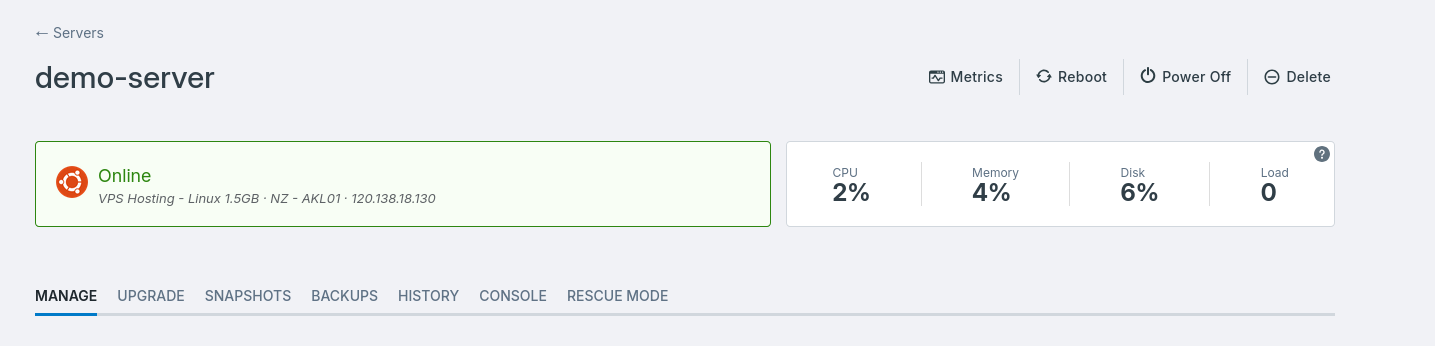
To get started, first visit one of your servers in CP. From there, you should see a button labelled Metrics in the top right near your power options. Click on this button to access your dashboard.
Authorization
The system we use to sign you into your account generates an auth token which is valid for a few hours. If your dashboard has been open in you browser for a while, you may start to notice that things aren't loading anymore, or you're getting errors. If this happens, please return to CP and click on the Metrics button again to restore your access.
New Servers
If a server was created recently, there's a chance it won't show up in your dashboard yet. This is normal, and will usually resolve itself within a few minutes once metrics start being pushed through.
You will need to refresh your dashboard page if you had it open prior to creating a new service, otherwise the service may not appear.
Filtering Data
By default, your dashboard will be filtered by whichever server you were viewing in CP when you clicked on the Metrics button.
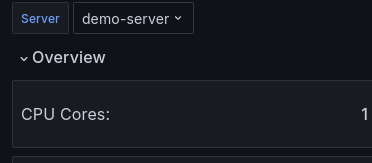
If you need finer control of these filters, or just want to change what you're looking at from within the dashboard directly, you can use the Server dropdown visible at the top of the page.