- Domains
- DNS Management
- Content Delivery Network
-
Cloud Containers
- Overview
-
Using Containers
- Creating and Managing
- Connecting to a Container
- Swapping the Image
- Domain Aliases
- Environment Variables
- Protected Environment Variables
- Backing Up
- Automatic Updates
- SSL Support
- Adjusting Execution Time Limits
- Upgrading Apache Image
- Renaming a Container
- Port Management
- Caching
- Cloning/Overwriting
- Restoring a Backup
- Production Mode
- Metrics Dashboard
- Accessing supervisord
- Container Deprecation
- SSH / SFTP Users
- Databases
- Volumes
- Custom Images
-
Technical Guides
- Create a NodeJS Container
- Creating a Service Container
- Working with .NET Core Web Containers
- Working with Node.js Web Containers
- Working with Umbraco Web Containers
- Deploying your application with git
- Python Container
- Enable Country-Level blocking in Cloud Containers
- Working with SQL Server Containers
- Working with the SilverStripe Caching folder
- Profiling a site using Xdebug on Cloud Containers
- Working with SilverStripe Containers
- NGINX Proxy for Service Containers
- Tuning PHP OPcache
- Deploying phpList on SiteHost Cloud Containers
- Deploying Mautic on SiteHost Cloud Containers
- Deploying n8n on SiteHost Cloud Containers
- Working with ModSecurity on Apache+PHP containers
- Low Disk Warnings & Upgrades
- Local Development
- Virtual Servers
- Dedicated Servers
- Private Cloud
- Cloud / Shared Hosting
- Email Hosting
- Monitoring & Bandwidth
- Account & Billing
- Developers
- SSL Certificates
- Networking
- AI Platform
Profiling a site using Xdebug on Cloud Containers
Xdebug is a PHP extension which is included with all standard PHP Cloud Container images that can be used to profile websites. When enabled, it creates cachegrind files every time a page is loaded. These files can be analysed and contain a code breakdown of the application based on the time spent running each function. This is very helpful since detecting slow code in an application can be key to optimising performance.
More information on what Xdebug can do is found on their official documentation pages: https://xdebug.org
This guide will cover how to enable Xdebug and set up Webgrind, a basic UI tool for analysing the collected data.
Setting up Xdebug
Be aware that enabling Xdebug will have an impact on server performance and should only be used when the site isn't expected to be receiving much traffic. Consider enabling it after-hours or at a time your site traffic is lower than usual.
Since Xdebug is a PHP extension, we must enable it from the PHP configuration directory of the Cloud Container.
cd /container/config/php/conf.dAll currently enabled PHP extensions are listed here. As Xdebug is quite resource-intensive, it is not enabled by default. To enable the module, create a symbolic link of the config file:
ln -s ../mods-available/xdebug.ini xdebug.iniNext step is to ensure that the extension will run by editing the extension’s configuration file:
vim ../mods-available/xdebug.iniand uncommenting the last two lines by removing ;:
; xdebug.mode=profile
; xdebug.output_dir=/container/application/
By default, the output directory is set to /container/application. This can be changed to any desired folder path, but be sure to note the new location as it will be required when setting up Webgrind.
Once the configuration file has been saved, restart the container and Xdebug will begin generating cachegrind files, which are saved in the output directory, every time the site is visited.
Setting up Webgrind
Webgrind is a web frontend for Xdebug profiling which can easily be set up inside a container. For the purpose of this article, the dashboard page will be accessible via example.com/webgrind.
Navigate to the container’s public directory and clone the webgrind repository:
cd /container/application/public
git clone https://github.com/jokkedk/webgrind.git
By default, webgrind will look for cachegrind files in /tmp. To change this path, open the config.php file:
nano webgrind/config.phpand modify the static $profileDir variable:
static $profileDir = '/container/application';Once updated, navigate to the webgrind dashboard using the URL example.com/webgrind which will bring up the following:
Click to open in a pop-up
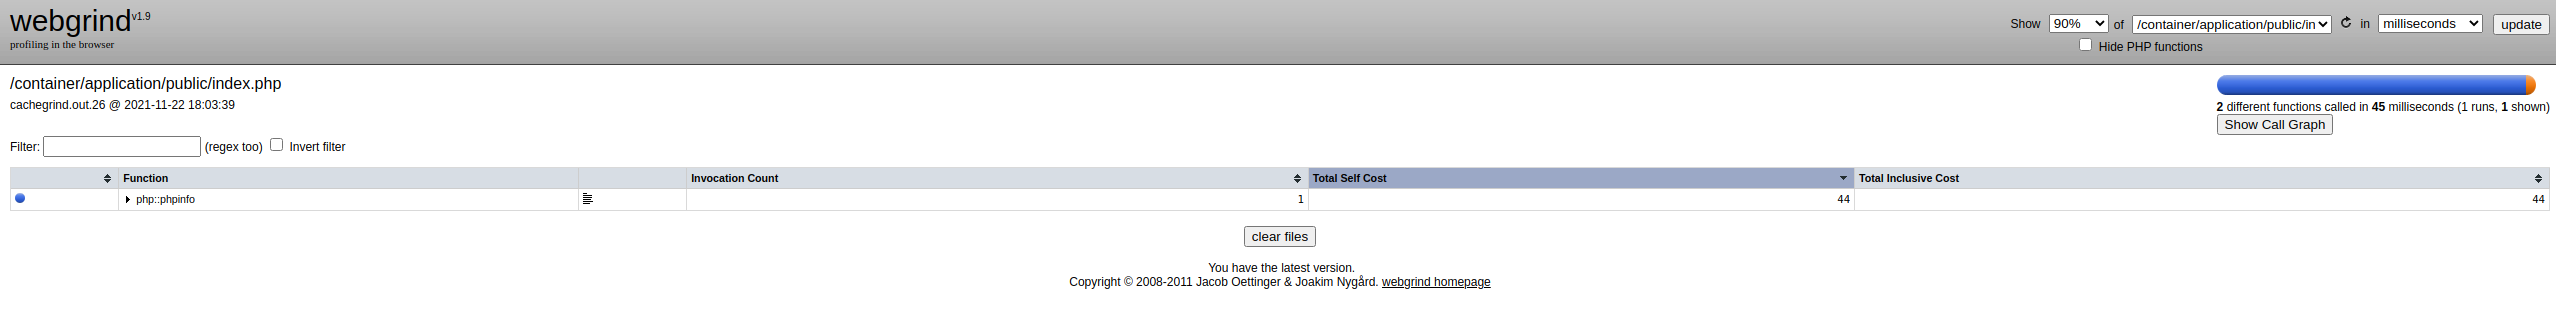
At the top left of the page, there will be a drop down menu to select the generated cachegrind files. For this demo, the site only had a phpinfo() page so there is not much to analyse. But in the case of a more complicated PHP application, the breakdown will be really interesting as there will be a time based summary of each function call in the application.
The settings can be modified from the first dropdown on the right side of the page to calculate the time spent as a percentage instead of milliseconds, which can be a better indicator of issues. For example, if a function is using 50% of the time, it can be a red flag for developers to investigate.
Remember to disable Xdebug by unlinking the extension in
/container/config/php/conf.d, remove the Webgrind files and restart the container once finished.